A technical analysis of INSMED INC (NASDAQ:INSM).
By Mill Chart
Last update: Mar 28, 2025
Our stock screener has identified INSMED INC (NASDAQ:INSM) as a potential breakout candidate. This technical breakout setup pattern occurs when the stock consolidates after a strong uptrend. While the actual breakout is uncertain, it may be worth keeping an eye on NASDAQ:INSM.
What is the technical picture of INSM telling us.
ChartMill assigns a Technical Rating to every stock. This score, ranging from 0 to 10, is updated daily and is determined by evaluating multiple technical indicators and properties.
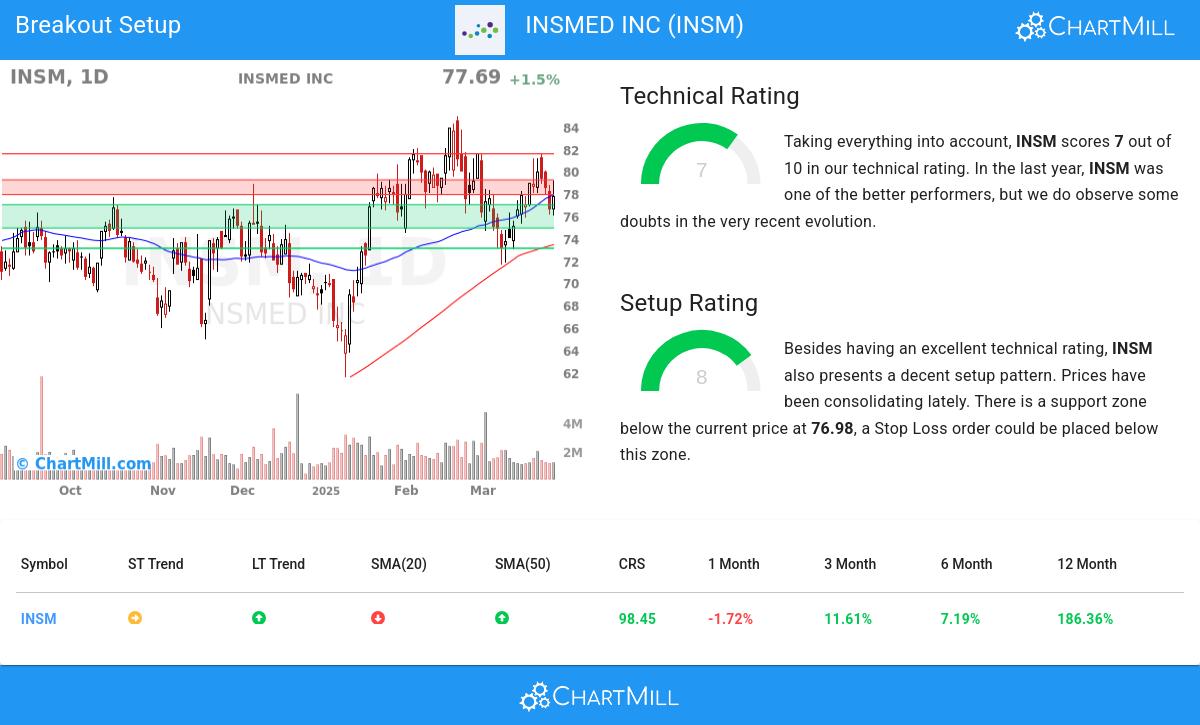
We assign a technical rating of 7 out of 10 to INSM. In the last year, INSM was one of the better performers, but we do observe some doubts in the very recent evolution.
- The long term trend is positive and the short term trend is neutral. The long term trend gets the benefit of the doubt for now.
- INSM is one of the better performing stocks in the Biotechnology industry, it outperforms 98% of 569 stocks in the same industry.
- INSM is currently trading in the upper part of its 52 week range. The market is still in the middle of its 52 week range, so INSM slightly outperforms the market at the moment.
- Looking at the yearly performance, INSM did better than 98% of all other stocks. However, this overall performance is mostly based on the strong move around 10 months ago.
- In the last month INSM has a been trading in the 71.57 - 81.62 range, which is quite wide. It is currently trading in the middle of this range, so some resistance may be found above.
Check the latest full technical report of INSM for a complete technical analysis.
How do we evaluate the setup for INSM?
In addition to the Technical Rating, ChartMill provides a Setup Rating for each stock. This rating, ranging from 0 to 10, assesses the level of consolidation in the stock based on multiple short-term technical indicators. Currently, INSM has a 8 as its setup rating, indicating its current consolidation status.
Besides having an excellent technical rating, INSM also presents a decent setup pattern. Prices have been consolidating lately. There is a support zone below the current price at 76.98, a Stop Loss order could be placed below this zone.
Trading breakout setups.
To potentially initiate a trade, it is common practice to wait for the stock to break out of the consolidation zone. This breakout signifies a potential upward movement, and traders may enter the stock at that point. Conversely, if the stock falls back below the consolidation zone, it may be sold at a loss.
Of course, there are many ways to trade or not trade INSM and this article should in no way be interpreted as trading advice. The article is purely based on an automated technical analysis and just points out the technical observations. Always make your own analysis and trade at your own responsibility.
More breakout setups can be found in our Breakout screener.
Keep in mind
This article should in no way be interpreted as advice. The article is based on the observed metrics at the time of writing, but you should always make your own analysis and trade or invest at your own responsibility.
68.57
+3.76 (+5.8%)
Find more stocks in the Stock Screener
INSM Latest News and Analysis
 13 hours ago - ChartmillFriday's after hours session: top gainers and losers
Discover the top movers in Friday's after-hours session and stay informed about the post-market dynamics.
 15 days ago - ChartmillA technical analysis of INSMED INC (NASDAQ:INSM).
INSMED INC (NASDAQ:INSM) Reveals Intriguing Technical Aspects. Indications Suggest NASDAQ:INSM Could Be on the Verge of a Breakout. Here's What You Need to Know.
